今天將是這個系列的最後一篇,未來可能再看不定時發佈,也感謝過程中各位的愛心與善心!
這次我們來談談雷達圖,相信大家可能或多或少都有玩過遊戲,或是想要比較一些能力的時候,就會看到一個像是航空雷達圖的樣子,所以今天就是來實現這樣的功能.
資料來源: NBA官網
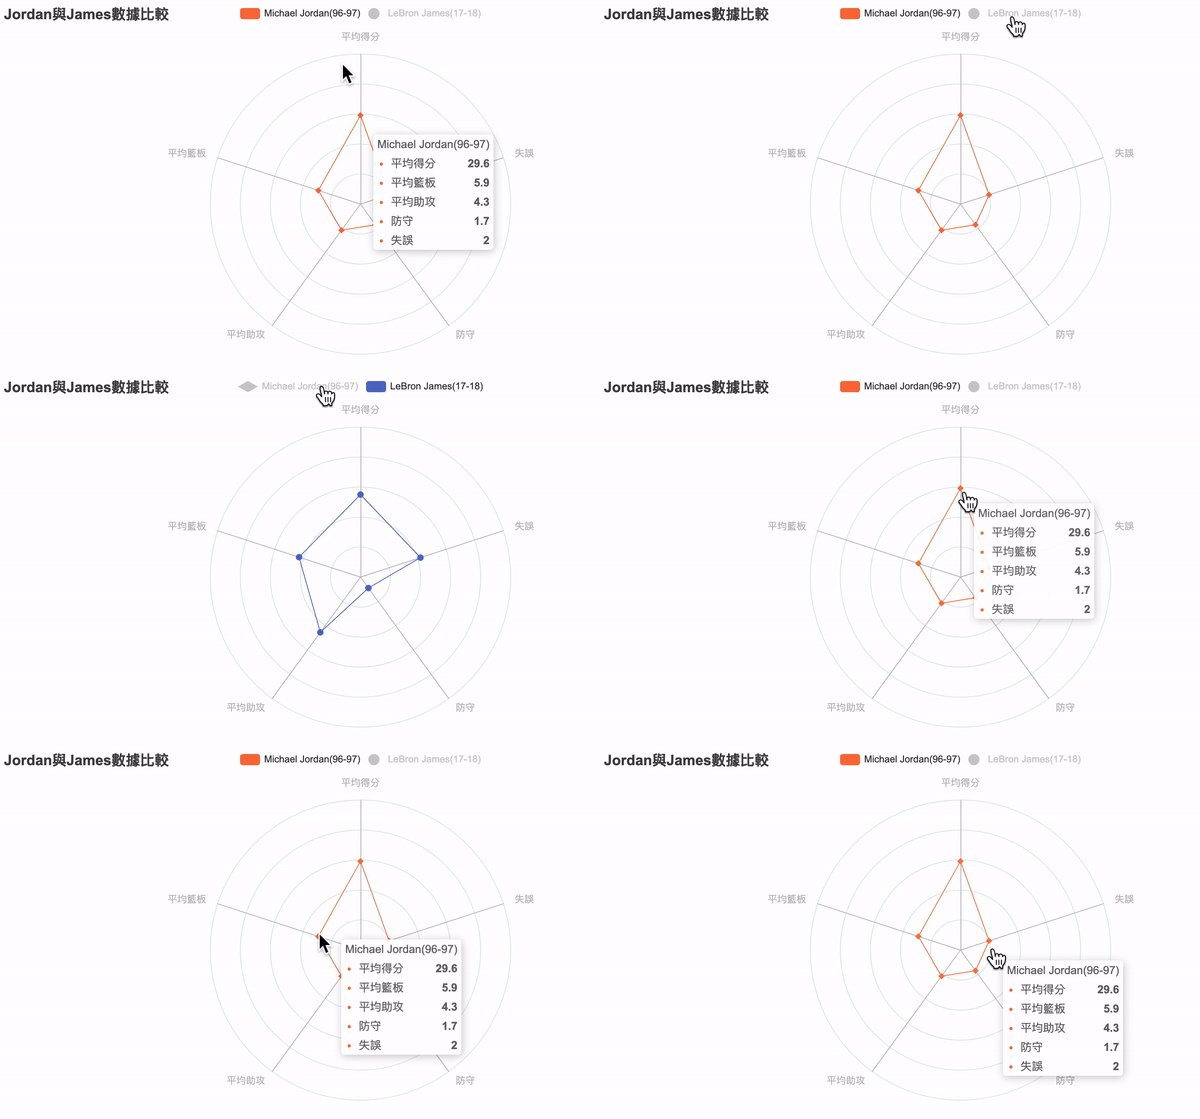
這次以NBA球星來做一個雷達圖比較,當然是拿我們的神喬丹來當作一個標的,另外取一個現役球員詹姆斯,以他們的能力畫出一個雷達圖.
0. 目標:
1. 載入需要套件
|
1 2 3 4 5 |
#雷達圖 #載入所需元件 from pyecharts.charts import Radar #雷達圖的套件 from pyecharts import options as opts from pyecharts.globals import ThemeType |
2. 特別注意此段!
這次在寫此篇遇到一個問題,jupyter的圖片一直出不來,後來想說採用產出HTML來看,但一樣無法,後來發現原來是pychars會引用到JS,讓圖表可以有互動性,所以在HTML檔案會看到,以下:
可以知道不論利用jupyter與產出HTML都是會有引用JavaScript,但就是因為此網址錯誤,導致:
|
1 |
https://assets.pyecharts.org/assets/echarts.min.js |
如果把上述網址貼上瀏覽器會發現無法連線,所以就是這樣導致,查了一下資訊看到此篇,故以下程式是將預設的URL改為可以使用的網址,不過要記得’echarts.min.js’不需要填入.
|
1 2 3 4 5 |
#處理JS無法連線 from pyecharts.globals import CurrentConfig default_host = CurrentConfig.ONLINE_HOST custom_host = "https://cdnjs.cloudflare.com/ajax/libs/echarts/5.1.2/" CurrentConfig.ONLINE_HOST = custom_host |
不過很可惜,實作用jupyter還是無法顯示圖片,所以以下說明改採產生HTML作為展示,未來找到方法再補充.
3. 建立初始化資料
|
1 2 |
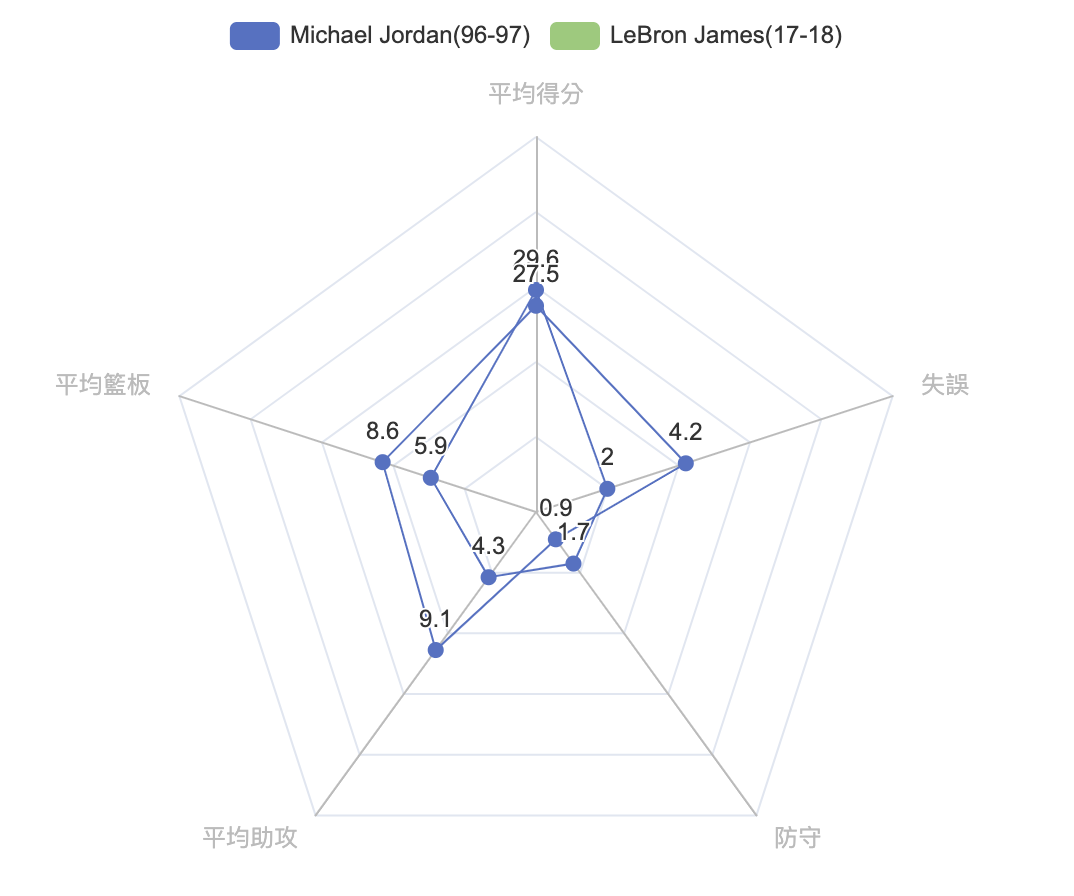
MJ = [[29.6, 5.9, 4.3, 1.7, 2]] #喬丹 LJ = [[27.5, 8.6, 9.1, 0.9, 4.2]] #詹姆士 |
4. 開始畫雷達圖
|
1 2 3 4 5 6 7 8 9 10 11 12 13 14 15 16 |
radar = ( Radar(init_opts=opts.InitOpts(theme=ThemeType.VINTAGE,)) .add_schema( #各項數值點呈現 schema=[ opts.RadarIndicatorItem(name="平均得分", max_=50), opts.RadarIndicatorItem(name="平均籃板", max_=20), opts.RadarIndicatorItem(name="平均助攻", max_=20), opts.RadarIndicatorItem(name="防守", max_=10), opts.RadarIndicatorItem(name="失誤", max_=10), ] ) .add("Michael Jordan(96-97)", MJ) #加入圖說 .add("LeBron James(17-18)", LJ) #加入圖說 ) radar.render('test.html') #存成html |
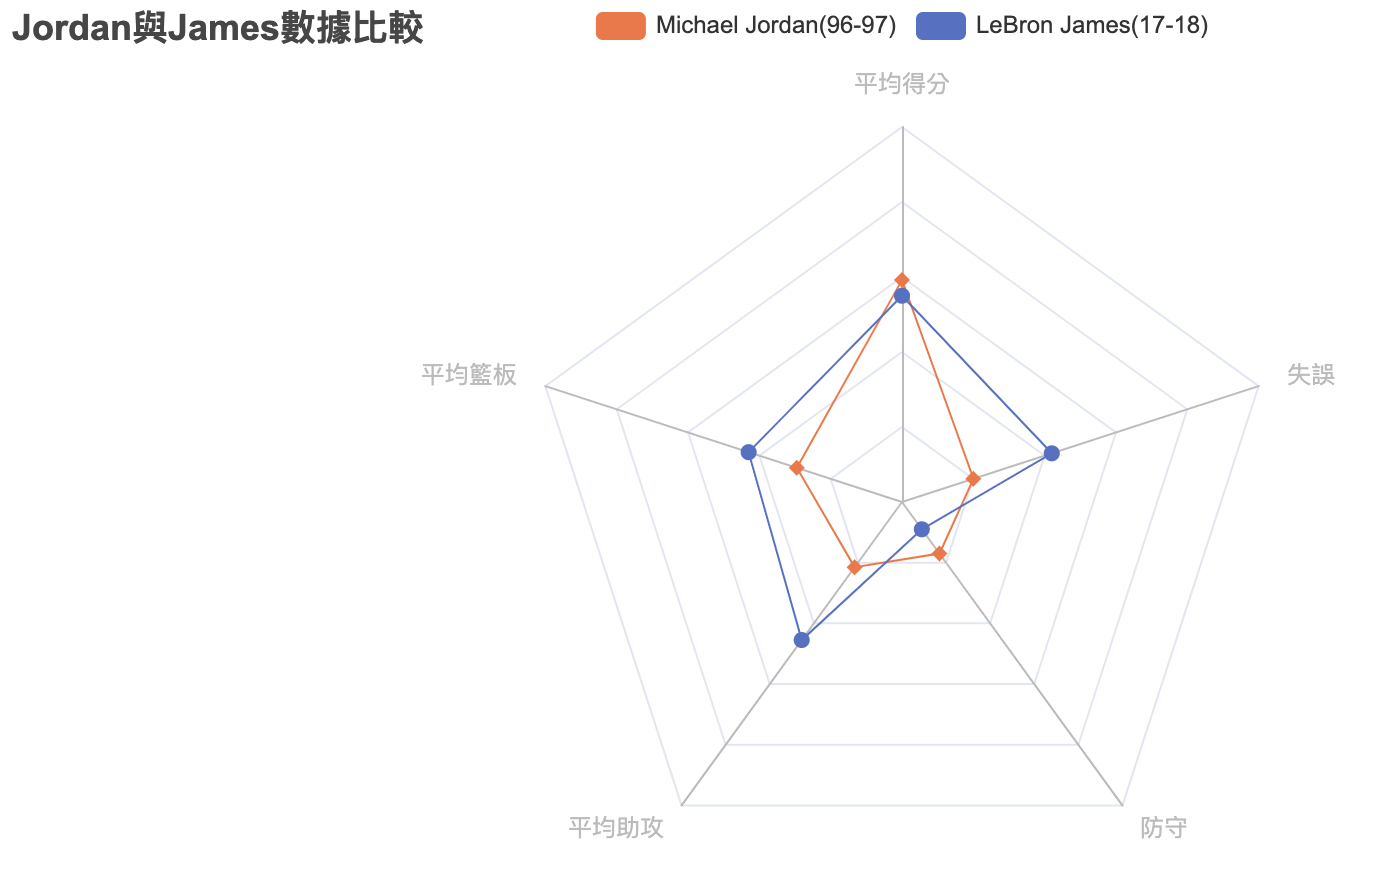
5. 上圖是不是看起來有點複雜,調整一下樣式,將小點上數值移除,加入標題
|
1 2 3 4 5 6 7 8 9 10 11 12 13 14 15 16 17 18 19 |
radar = ( Radar(init_opts=opts.InitOpts(theme=ThemeType.VINTAGE,)) .add_schema( schema=[ opts.RadarIndicatorItem(name="平均得分", max_=50), opts.RadarIndicatorItem(name="平均籃板", max_=20), opts.RadarIndicatorItem(name="平均助攻", max_=20), opts.RadarIndicatorItem(name="防守", max_=10), opts.RadarIndicatorItem(name="失誤", max_=10), ] ) .add("Michael Jordan(96-97)", MJ, color="#f9713c", symbol='diamond' ) .add("LeBron James(17-18)", LJ) .set_series_opts(label_opts=opts.LabelOpts(is_show=False)) .set_global_opts( title_opts=opts.TitleOpts(title="Jordan與James數據比較"), ) ) radar.render('test.html') |
6. 但有發現兩個數據重疊,可否個別顯示呢?
|
1 2 3 4 5 6 7 8 9 10 11 12 13 14 15 16 17 18 19 20 21 |
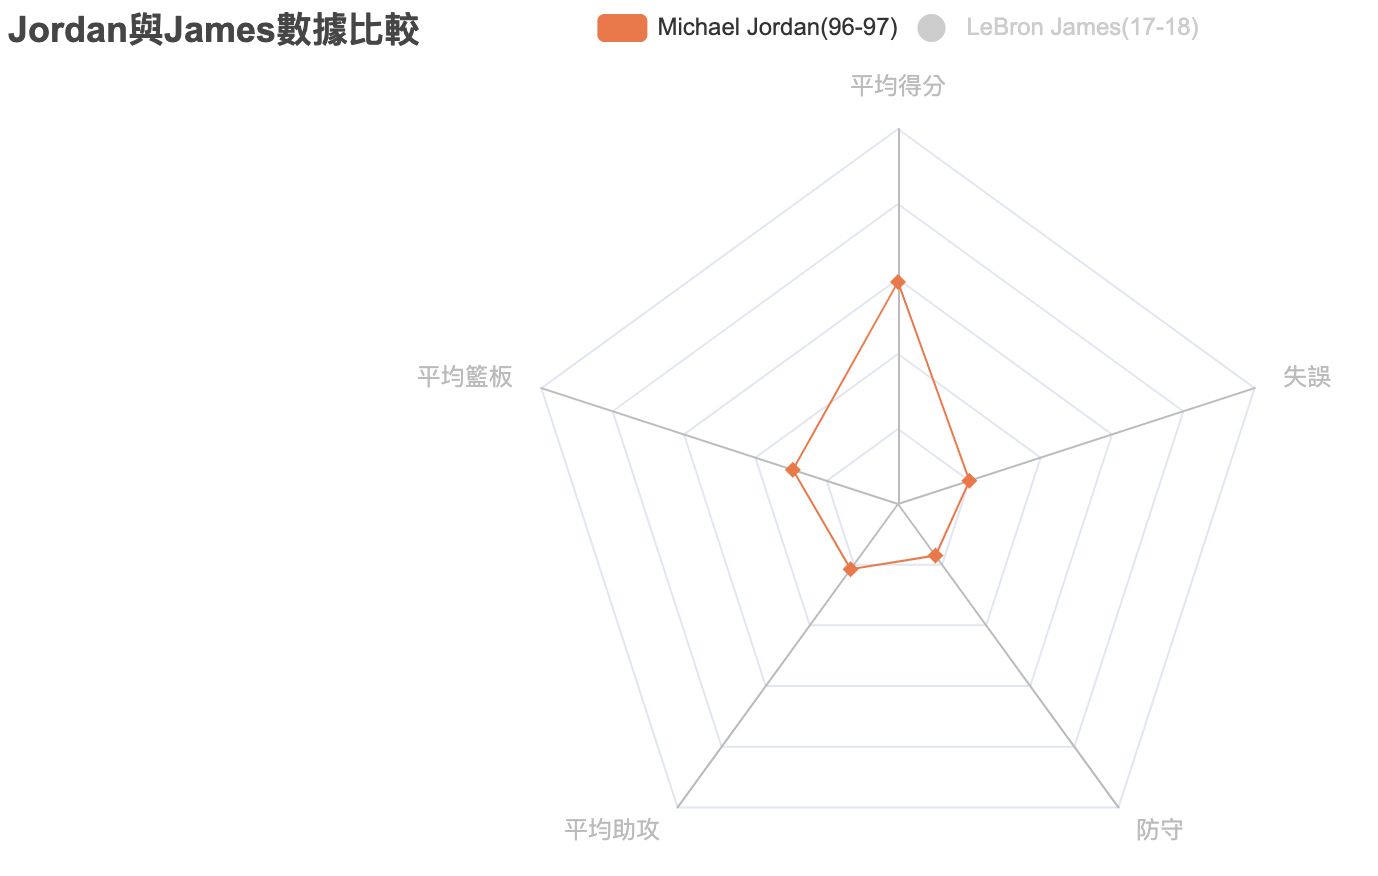
radar = ( Radar(init_opts=opts.InitOpts(theme=ThemeType.VINTAGE,)) .add_schema( schema=[ opts.RadarIndicatorItem(name="平均得分", max_=50), opts.RadarIndicatorItem(name="平均籃板", max_=20), opts.RadarIndicatorItem(name="平均助攻", max_=20), opts.RadarIndicatorItem(name="防守", max_=10), opts.RadarIndicatorItem(name="失誤", max_=10), ] ) .add("Michael Jordan(96-97)", MJ, color="#f9713c", symbol='diamond' ) .add("LeBron James(17-18)", LJ) .set_series_opts(label_opts=opts.LabelOpts(is_show=False)) .set_global_opts( #讓數據個別顯示 legend_opts=opts.LegendOpts(selected_mode="single"), title_opts=opts.TitleOpts(title="Jordan與James數據比較"), ) ) radar.render('test.html') |
7. 雷達圖只有一種樣式嗎?
|
1 2 3 4 5 6 7 8 9 10 11 12 13 14 15 16 17 18 19 20 21 22 23 |
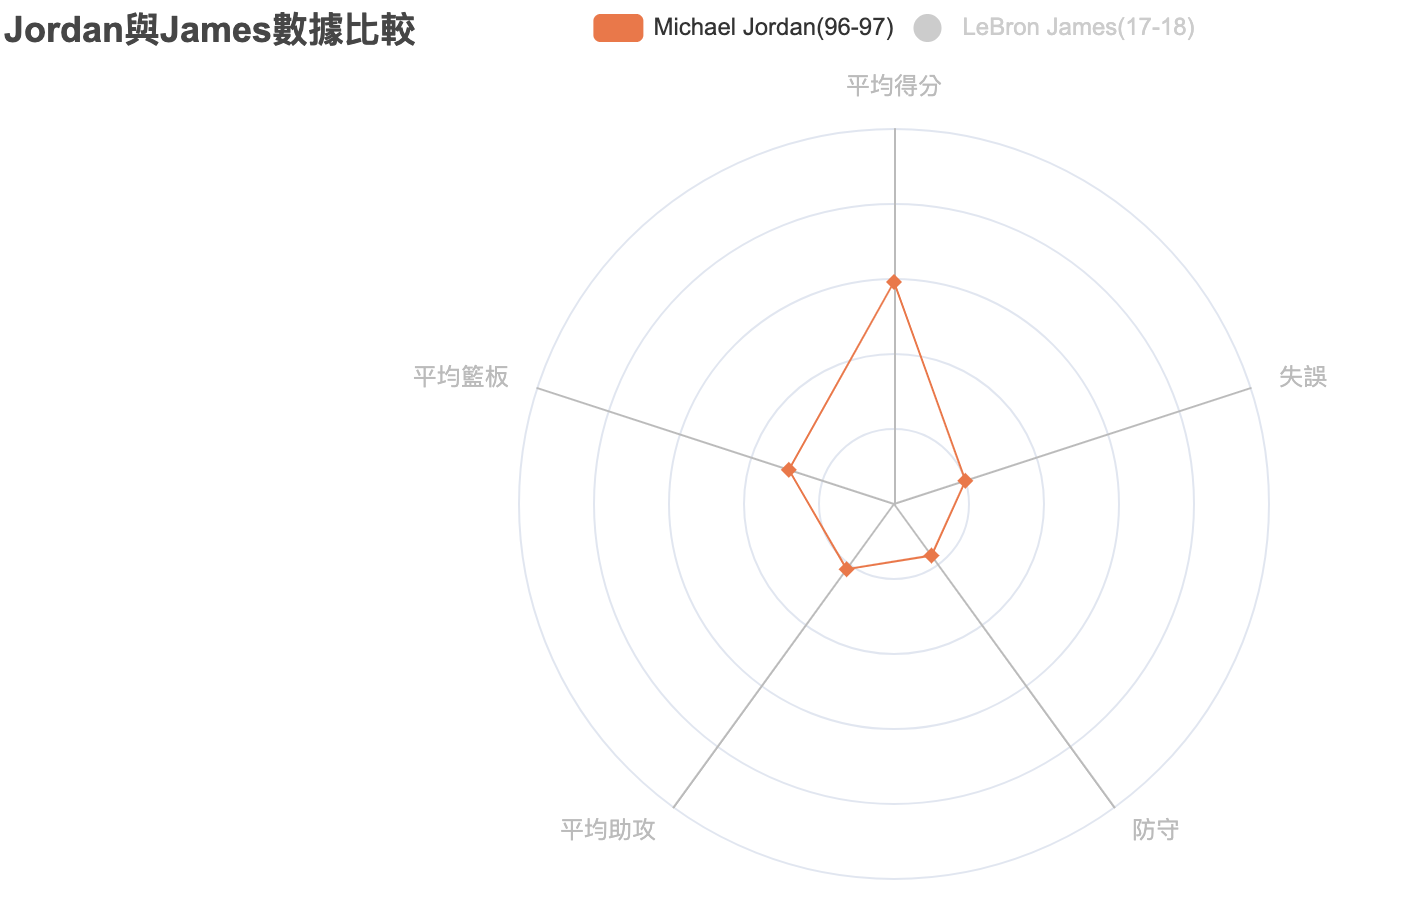
radar = ( Radar(init_opts=opts.InitOpts(theme=ThemeType.VINTAGE,)) .add_schema( #將雷達圖改為圓型 shape='circle', schema=[ opts.RadarIndicatorItem(name="平均得分", max_=50), opts.RadarIndicatorItem(name="平均籃板", max_=20), opts.RadarIndicatorItem(name="平均助攻", max_=20), opts.RadarIndicatorItem(name="防守", max_=10), opts.RadarIndicatorItem(name="失誤", max_=10), ] ) #將小點,改為diamond形狀 .add("Michael Jordan(96-97)", MJ, color="#f9713c", symbol='diamond' ) .add("LeBron James(17-18)", LJ) .set_series_opts(label_opts=opts.LabelOpts(is_show=False)) .set_global_opts( legend_opts=opts.LegendOpts(selected_mode="single"), title_opts=opts.TitleOpts(title="Jordan與James數據比較"), ) ) radar.render('test.html') |
按照往例寫在後頭:
身為一個IT與企業人,取之網路用之網路,也想為社會上盡一些力量,做點CSR(企業社會責任 Corporate Social Responsibility),透過我小小的力量,藉此拋磚引玉,我整理了相關視覺化資料簡報(目前約一百多頁)與怎麼畫圖表的程式碼都已經寫成Step by Step的Jupyter Notebook教學文件,有些會陸續在Blog說明,但若各位賢達也想給予鼓勵做些公益,歡迎到任何慈善公益團體捐款(E.g 罕見疾病、脊髓損傷、唐寶寶、愛貓愛狗…etc,比較小型的公益團體),讓愛心可以分散力量發揮出去,並且透過留言聯繫我,提供捐款證明,我將此份文件無償提供給您參考(文件會陸續更新,以當下最新版本提供).
ps 給醫護鼓勵打氣也可以啊~
